

How to read a fermentation curve: A guide for breweries using PLAATO Pro
Fermentation is the heart of brewing, and with the advent of precision sensors like the PLAATO Pro, brewers now have real-time access to detailed fermentation curves. These curves, generated through in-tank sensors, provide a continuous readout of specific gravity (SG), temperature and rate of fermentation, allowing brewers to gain deep insights into the performance of their yeast and the overall health of the fermentation process.
In this guide, we’ll walk through how to read a fermentation curve, interpret key phases, and extract valuable information that can be used to optimize quality, consistency, and efficiency in professional brewing environments.

What is a fermentation curve?
A fermentation curve is a graphical representation of specific gravity (SG) over time. As yeast consumes sugars in the wort and produces alcohol and CO₂, the SG drops. When plotted, this downward trend produces a curve that reflects the different stages of fermentation. With products like PLAATO Cloud, you can also view manually input variables such as pH on the same timeline, giving you a multidimensional understanding of what’s happening inside your tank.


The role of PLAATO Pro
PLAATO Pro is a real-time, in-situ density and fermentation monitoring system designed for professional breweries. It provides:
Continuous SG readings with high precision
Integration with existing brewing software, such as Breww and Beer30
Cloud-based data access
Batch comparisons and historical trends
By using PLAATO Pro, brewers can eliminate guesswork and make decisions based on real-time fermentation kinetics rather than subjective metrics like bubbling in the spunding valve or scheduled calendar days.
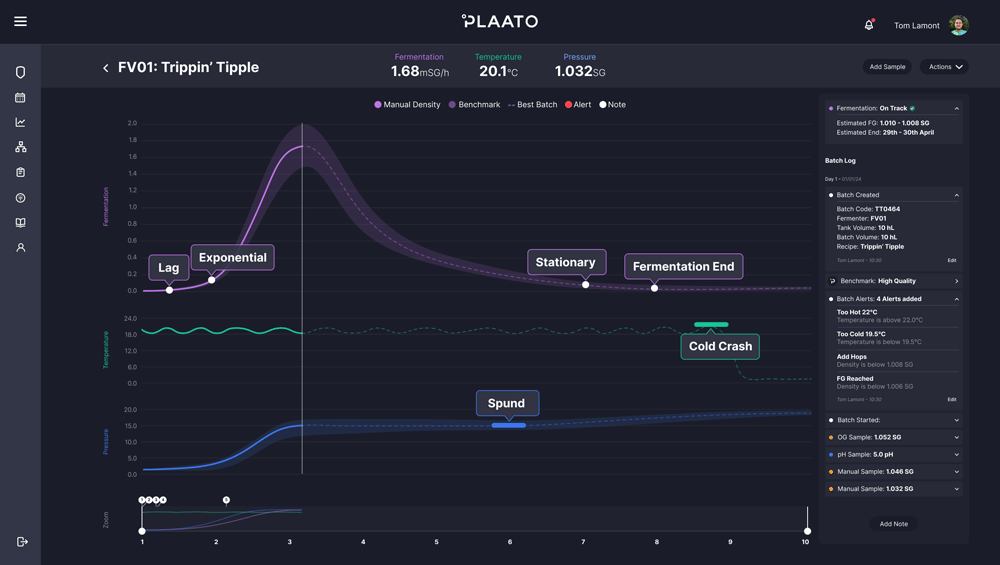
Anatomy of a fermentation curve
Before diving into what you can do with the curve, let’s break down what the typical fermentation curve looks like.
Lag Phase
Time: First few hours post-pitching - up to typically 12 hours
Curve Behavior: Flat SG line
What’s Happening: Yeast is hydrating, absorbing nutrients, and preparing for fermentation. No significant SG change yet.
Exponential (Log) Phase
Time: 12–48 hours post-pitch
Curve Behavior: Sharp drop in SG
What’s Happening: Rapid sugar conversion, CO₂ production, and cell growth. Yeast is most active.
Stationary Phase
Time: 3–7 days into fermentation
Curve Behavior: SG drop slows significantly
What’s Happening: Yeast activity decreases as sugars become depleted. By-products like diacetyl may be cleaned up during this phase.
End of Fermentation
Curve Behavior: SG flattens and stabilizes at final gravity
What’s Happening: Most fermentable sugars have been consumed. Time to decide on next process steps.
Key applications of the fermentation curve
Below are common and advanced ways brewers use fermentation curves in daily operations:
1. Determining End of Fermentation
A stabilized SG over 24–48 hours is a clear sign that fermentation has completed. This is a more accurate and safer method than simply waiting a set number of days.
2. Diacetyl Rest Timing
By observing the SG curve and identifying when it slows down (stationary phase), brewers can increase temperature at the optimal moment to encourage yeast to reabsorb diacetyl—avoiding buttery off-flavors.
3. Timing the Cold Crash
A flat SG and low activity curve signals when it’s safe to lower temperature without risking incomplete fermentation or diacetyl presence.
4. When to Dry Hop Hazy IPAs
Dry hopping during active fermentation (typically 1.010–1.015 SG) encourages biotransformation. By watching the curve’s slope, you can pinpoint this window.
5. Spunding Timing
To trap the ideal level of natural CO₂, you can close the spunding valve during the final points of fermentation. The curve tells you exactly when that is.
6. Comparing Fermentation Kinetics Across Batches
Overlay fermentation curves from different batches or tanks to spot variances caused by yeast vitality, oxygenation levels, or wort composition.
7. Tracking the Lag Phase
A longer-than-normal lag phase could indicate yeast stress or underpitching. Monitoring this helps spot potential issues early.
8. Assessing Yeast Health
Unusual slopes, plateauing mid-fermentation, or extended durations suggest poor yeast vitality or contamination.
9. Rate of Fermentation
The slope of the curve can be used to calculate sugar consumption per hour, which reflects yeast performance and process repeatability.
Additional insights you can gain from the fermentation curve
Beyond the common applications, there are many less-obvious, yet powerful insights you can derive from your fermentation data:
10. Predicting Final Gravity
By modeling the curve during exponential phase, brewers can estimate the likely final gravity and adjust for attenuation targets earlier.
11. Early Detection of Stuck or Sluggish Fermentations
A plateau or shallow curve too early can indicate potential problems like:
Nutrient deficiencies
Low yeast vitality
Undetected contamination
This allows for quick troubleshooting before batch quality is compromised.
12. Evaluating Impact of Recipe Changes
Want to test a new malt or adjunct? Use curve comparisons to assess how it affects fermentation time and behavior—objective, repeatable insights.
13. Tank-Specific Performance
Some tanks may ferment faster or slower than others due to differences in geometry or cooling efficiency. Fermentation curves help identify these inconsistencies.
14. Temperature Control Effectiveness
Overlaying SG with temperature reveals whether temp changes were effective and how quickly the yeast responded.
15. Assessing Beer Style Characteristics
High-gravity beers show different fermentation kinetics than session beers. Understanding these differences improves your ability to scale across styles.
Real-World interpretations
Let’s say you’re fermenting a hazy IPA and notice that the SG drops rapidly from 1.060 to 1.020 within 48 hours, then levels off for a day. This stall could indicate:
Oxygen depletion
Nutrient limitation
Premature flocculation
By knowing this from the curve, you can respond with:
Gentle rousing
Yeast nutrient addition
Adjustments in future batches

Best practices for using fermentation curves
Here are a few practical tips when reading fermentation curves in real-time:
1. Always cross-reference with yeast strain characteristics.
Different strains behave differently. Know their typical fermentation windows.
2. Use alarms or alerts for unusual behavior.
PLAATO Pro can notify you if the curve flattens too early or deviates from expectations.
3. Document external interventions.
If you adjust temperature or oxygenation, log it. This helps correlate interventions with curve behavior later.
4. Compare curves in context.
Overlay batches made with the same recipe to look for subtle drift—signs of process deviation.
5. Look beyond SG.
Use multi-metric plots (e.g., temperature, pH) to get the full picture.
Conclusion
Fermentation curves offer a real-time, precise, and highly visual representation of yeast performance and process stability. With a tool like PLAATO Pro, brewers gain more than just data—they gain control. From improving product quality to reducing time-to-package and minimizing risk, the insights you can derive from these curves are transformative.
By reading the fermentation curve not just as a line but as a story of microbial activity, brewers can consistently produce better beer, faster, and with less waste. Whether you’re managing a single tank or optimizing an entire cellar, mastering the fermentation curve is a modern brewing essential.
And if you're serious about understanding fermentation, PLAATO Pro is built for brewers like you.
Want to see how it works in your brewery?